Caution for Investors and Traders: S&P 500 Weekly RSI at 79.5 – A Technical Analysis
Description:
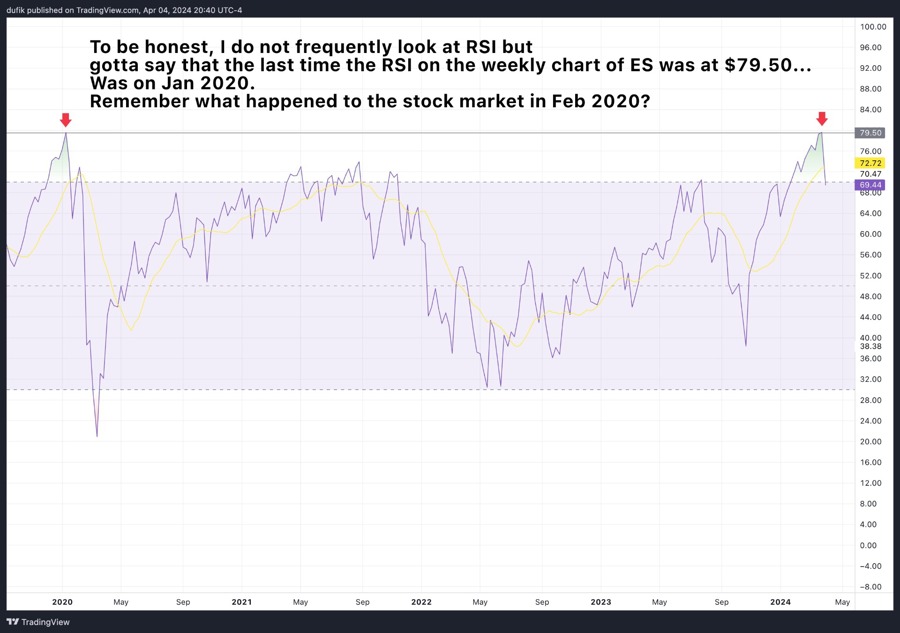
Fellow stock market investors & traders: Watch the high weekly RSI Today, let’s delve into a valuable tool for navigating the S&P 500 Emini futures market: the Relative Strength Index (RSI). The chart you see here displays the RSI for the S&P 500 e-mini futures, the main gauge of the entire US stock market.
The RSI Rundown: Gauging Momentum in a Flash ⚡
The RSI is a momentum indicator, measuring the speed and strength of price movements on a scale of 0 to 100. Think of it as a market speedometer. When the RSI is above 70, it typically indicates an overbought condition, suggesting that the market may be due for a correction. Conversely, when the RSI is below 30, it signals an oversold condition, potentially indicating a buying opportunity.
It is important for investors and traders to pay attention to the RSI levels, especially when it reaches extreme levels like the current 79.5 reading on the S&P 500 weekly chart. This high RSI level may indicate that the market is overextended and could be vulnerable to a pullback in the near future.
When making trading decisions, it is crucial to use the RSI in conjunction with other technical indicators and analysis tools to confirm potential signals and avoid false alarms. Remember, no single indicator should be used in isolation to make trading decisions.
How This Will Affect Me:
As an individual investor or trader, the high RSI reading on the S&P 500 weekly chart should serve as a warning sign to proceed with caution. It may be wise to consider taking profits on existing positions or tightening stop-loss levels to protect gains. Additionally, this could be an opportunity to look for short-term bearish trading opportunities or consider hedging strategies to mitigate downside risk.
How This Will Affect the World:
The S&P 500 is a key benchmark index that reflects the overall performance of the US stock market. A high RSI reading on this index could have broader implications for global markets and investor sentiment. If the S&P 500 experiences a significant pullback due to the overbought conditions signaled by the RSI, it could potentially trigger a sell-off in other major indices around the world, impacting investor confidence and market stability.
Conclusion:
In conclusion, the S&P 500 weekly RSI reaching 79.5 is a critical technical signal that investors and traders should not ignore. While high RSI readings alone do not guarantee a market reversal, they do indicate elevated risk levels that warrant caution and careful risk management. By staying informed and utilizing a combination of technical tools, investors can better navigate market volatility and make informed trading decisions.


