Diving into the Russell 2000 and the Current Market Situation
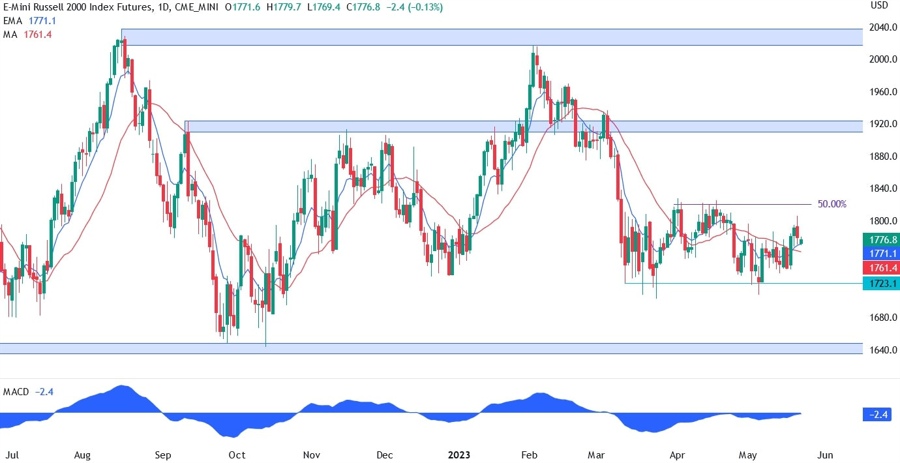
Let’s take a closer look at the daily chart of the Russell 2000 index and analyze its recent movements. As we can see, the index has been trading in a range between the 1723 support and the 50% Fibonacci resistance ever since the collapse of the Silicon Valley Bank. The Russell 2000 index is known for being more sensitive to regional bank stocks compared to other major indices, which is why it has been underperforming as of late.
On the monetary policy side, the Federal Reserve is hinting at a pause in interest rate hikes for June, although they are keeping the option open for another hike if economic data continues to show strength. This cautious approach is in line with the Fed’s goal of maintaining a balance between economic growth and inflation.
How Will This Affect Me?
For individual investors, the performance of the Russell 2000 index can have an impact on their portfolio, especially if they have exposure to regional bank stocks. It’s important to stay informed about the latest developments in the market and adjust your investment strategy accordingly.
How Will This Affect the World?
The performance of the Russell 2000 index can also have broader implications for the global economy. As a key indicator of small-cap stocks in the US, its movements can influence investor sentiment and market dynamics worldwide. Keep an eye on how the index performs in the coming months to gauge the overall health of the global economy.
In Conclusion
As we navigate through these uncertain times in the market, it’s essential to stay informed and make strategic decisions based on the latest data available. The Russell 2000 index’s movements are just one piece of the puzzle, but they can provide valuable insights into the current state of the economy. Keep an eye on the support and resistance levels mentioned earlier to get a better understanding of where the market may be headed next.


